EOD Blog April 15, 2025
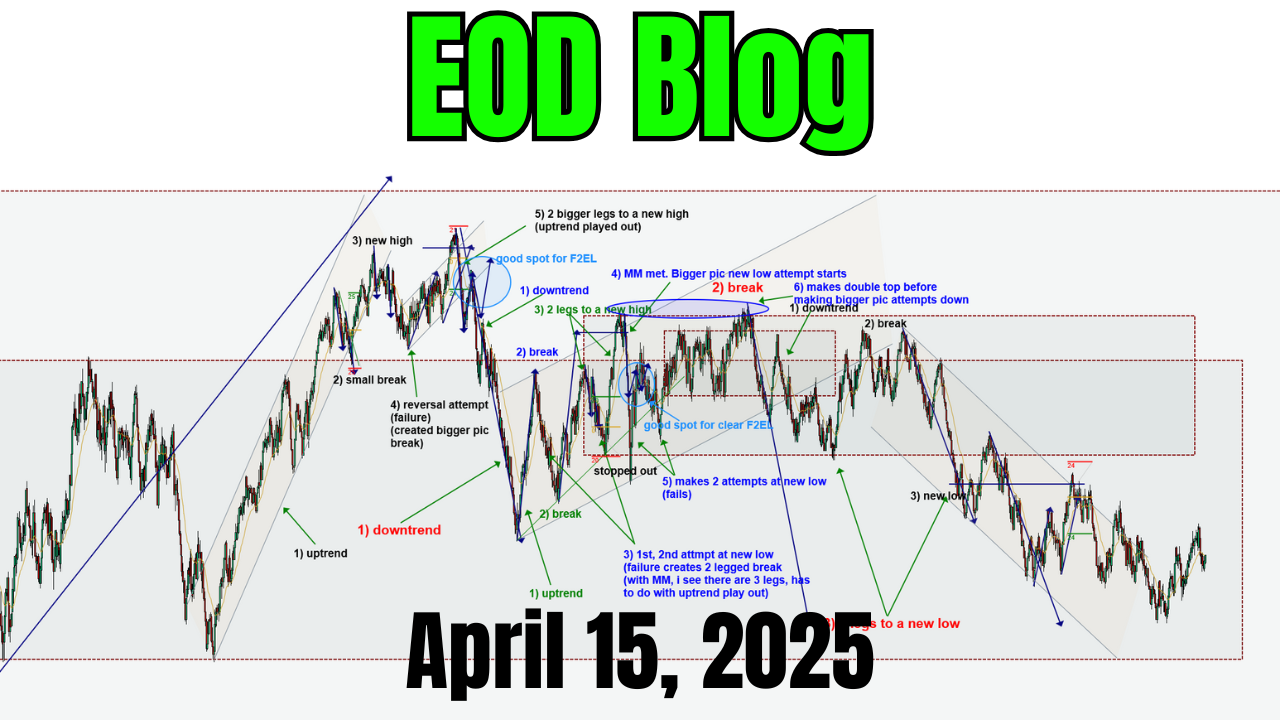
Here's the 2000 tick chart for the ES. Today I mainly traded the 500 tick ES chart, but also just got out of a 25 point short on the NQ 250 tick, I've got another short on the ES in the same area going still. Above we see the uptrend from 2 days ago, price broke it then made 2 legs up attempting a new high, the 2nd leg up ending around 9am CST today. Price made a quick fade of the OVH, made a couple legs back retesting the OVH then made a 2nd leg down.